Bearish Harami Cross: A Signal of Strong Bearish Trend
- Prathamesh Tawde
- December 16, 2023
Introduction to Bearish Harami Cross candlestick pattern
What is a Bearish Harami Cross?
In technical analysis, candlestick patterns are crucial. They help traders make informed choices. One such pattern is the Bearish Harami Cross. What precisely is it, and why does it hold such significance? Let’s dive deep into understanding this intriguing pattern.
Understanding the Basics
Definition of a Harami Pattern
Before we delve into the specifics of a Bearish Harami Cross, you must grasp what a Harami pattern is. The term “Harami” comes from the Japanese word for “pregnant.” It indicates a pattern where a small candlestick is engulfed by a larger one. This pattern can indicate a potential reversal in market trends.
Bearish vs. Bullish Harami Patterns
Harami patterns can be either bullish or bearish. A Bullish Harami shows a possible uptrend reversal in a downtrend. A Bearish Harami suggests a downtrend reversal in an uptrend. The key difference is in the market’s direction and the colors of the candlesticks.
Components of a candlestick pattern

The First Candle: Characteristics and Significance
A Bearish Harami Cross starts with a long-bodied candle. It aligns with the current uptrend. This candle reflects strong bullish sentiment in the market.
The Second Candle: Characteristics and Significance
The second candle, a doji, is the defining feature of the Bearish Harami Cross. A doji shows market indecision. It has very small or no bodies and wicks of similar length. The doji must fit inside the previous candle. It symbolizes a loss of bullish momentum and hints at a potential reversal.
Formation and Identification
Visual Representation
The candlestick pattern is straightforward to identify. You’ll see a big bullish candle. A doji follows it. The doji is completely inside the first candle’s body. This visual cue is a warning sign for traders that the prevailing uptrend may be losing steam.
Key Indicators and Signals
To identify a Bearish Harami Cross, look for key signs. These include the doji’s placement and the prior candle’s size. Additionally, volume can play a crucial role. A volume drop during the pattern’s formation can also confirm a potential reversal.
Psychology of candlestick pattern
Market Sentiment
The candlestick pattern encapsulates a shift in market sentiment. Bullish sentiment is strong, driving prices up. But the doji’s appearance shows doubt and a lack of continuation. It suggests that bullish sentiment is waning.
Trader Behavior
When traders spot a pattern, it often triggers caution. The pattern suggests that buying pressure is weakening. This is making traders rethink their positions. They are preparing for a bearish reversal.
Comparison with Other Candlestick Patterns
Bearish Engulfing Pattern
Unlike the Bearish Harami Cross. A Bearish Engulfing Pattern has a small bullish candle. A larger bearish candle follows it. The larger candle completely engulfs the previous one. This pattern is generally considered stronger due to its completely engulfing nature.
Evening Star Pattern
The Evening Star Pattern is another pattern signaling a bearish reversal. It involves three candles. There is a big bullish candle, a small candle (which can be bullish or bearish), and a big bearish candle. Both patterns state potential reversals. But the Evening Star is usually more clear and dramatic.
Bearish Harami Cross vs Bullish Harami Cross
Bearish Harami Cross
- Appears in an uptrend.
- First Candle: A large bullish (white or green) candle indicating strong upward movement.
- Second Candle:
It’s a small doji candle and its opening and closing prices are very close. It is within the first candle’s body.
Suggests that the uptrend may be slowing. A bearish reversal could be coming.
Bullish Harami Cross
- Appears in a downtrend.
- First Candle: A large bearish (black or red) candle indicating strong downward movement.
- Second Candle: A small doji candle that is entirely within the real body of the first candle.
Suggests the downtrend may be slowing. A bullish reversal could be coming.
Reliability and Effectiveness
Historical Performance
The candelstick pattern has shown to be a reliable indicator in various markets. Looking at past performance shows this pattern. It can come before big market reversals. This is especially true when other indicators confirm it.
Success Rate in Different Markets
The success rate of thecandelstick pattern can vary across different markets. It tends to be more reliable in stable and less volatile markets. But, in very volatile environments like cryptocurrencies, you often need extra confirmation.
Trading Strategies
Entry and Exit Points
Traders use the Bearish Harami Cross in trading strategies. The doji’s appearance is a key entry signal. Traders often look for confirmation from next price action before entering a position. Traders set exit points based on support and resistance levels. They also use other technical indicators.
Risk Management
Effective risk management is essential when trading based on the Bearish Harami Cross. Traders commonly place stop-loss orders just above the first candle’s high. This helps to cut losses if the reversal doesn’t happen.
Case Studies and Real-World Examples
Historical Bearish Harami Cross Instances
Examining historical instances of the Bearish Harami Cross provides valuable insights. For example, in the stock market, many popular stocks have shown this pattern. Then, they had big price drops.
Analysis of Outcomes
Analyzing the outcomes of these instances helps traders understand the pattern’s effectiveness. For instance, look at the prices after the pattern forms. They can show its predictive power.
Common Misconceptions and Pitfalls
Misinterpreting the Pattern
One common misconception is mistaking any doji in an uptrend for a Bearish Harami Cross. It’s crucial to ensure that the doji fits within the body of the preceding candle.
Over-reliance on Single Indicators
Relying only on the Bearish Harami Cross can lead to false signals. It would help if you considered other indicators. It’s crucial to combine this pattern with other technical analysis tools.
Advanced Analysis Techniques
Multi-Time Frame Analysis
Using multi-timeframe analysis can provide a broader perspective. For instance, you can spot a Bearish Harami Cross on a daily chart. Then, you can confirm it on a weekly chart. This can strengthen the signal.
Tools and Software for Identifying pattern
Charting Platforms
Many popular charting platforms like TradingView, MetaTrader, and Thinkorswim offer tools. The tools can find and analyze candlestick patterns. The patterns include the Bearish Harami Cross.
How To Find Bearish Harami Cross Pattern Using Chartink.Com
Chartink.com Overview
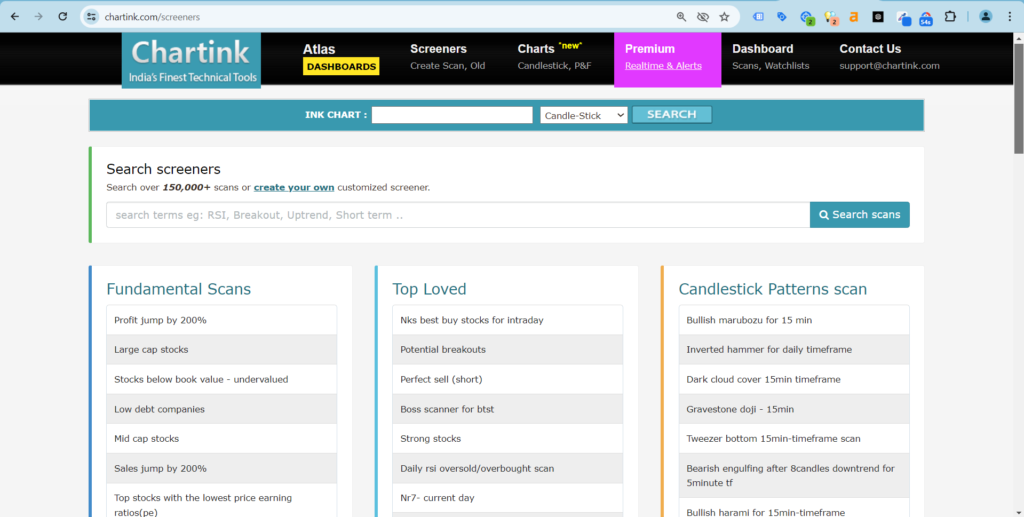
Chartink.com is an online stock screener and charting tool. It lets traders scan for technical patterns and analyze market trends. Chartink.com has customizable filters and an easy interface. It’s a great resource for traders.
Below is the screenshot of how the websibsite looks , You can simply
Trading Software Recommendations
You can search for Bearish Harami Cross Patter in screeners. It will show you all stock charts with a hammer pattern.
You can customize software like TradeStation and NinjaTrader to set alerts. They can alert you when a Bearish Harami Cross forms. This helps traders find trading opportunities.
Expert Opinions and Insights
Views from Professional Traders
Professional traders often see the Bearish Harami Cross as a reliable signal. But it’s a conservative one. They emphasize the importance of confirmation and risk management.
Market Analyst Perspectives
Market analysts suggest that the Bearish Harami Cross is valuable. But it should be seen in the context of broader market trends and economic conditions.
Conclusion
The Bearish Harami Cross is fascinating. It is also useful in the arsenal of technical analysis. Traders can make more informed decisions by understanding its formation, psychology, and application. But you must use this pattern with other signs. Also, you must keep a disciplined approach to risk.
FAQs
The Bearish Harami is a candlestick pattern. It shows a possible end to an uptrend. It consists of two candlesticks. The first is large and bullish. A smaller candlestick follows it. This one is fully contained within the body of the first.
The Bearish Harami pattern forms in two stages:
First Candlestick: A large bullish candlestick is formed, indicating strong buying pressure.
Second Candlestick: A smaller bearish candlestick forms inside the first one. This suggests a loss of bullish momentum.
Beginners can spot a Bearish Harami Cross by looking for a big up candle. It’s followed by a doji that fits within the first candle. Using charting software with pattern recognition can also help.
The Bearish Harami’s reliability depends on many factors. These include the pattern’s context, volume confirmation, and market conditions. Traders often use additional technical analysis tools for confirmation.
The main difference lies in the second candle. A Bearish Harami has a small bearish or bullish candle inside the body of a larger bullish candle. A Bearish Harami Cross has a doji as the second candle.


I’m Prathamesh Tawde, a leading figure in the dynamic world of financial markets. Born on March 30, 1986, in the vibrant city of Thane, Maharashtra, I’ve nurtured a profound passion for technical analysis and a commitment to guiding individuals toward successful trading journeys. With a mission to empower and educate, I’ve carved a distinct niche as a content creator, educator, and mentor.