Bullish Harami Cross: A Powerful Candlestick Pattern
- Prathamesh Tawde
- December 16, 2023
Introduction
What is a Harami Cross Pattern?
In trading, the Bullish Harami Cross is a candlestick pattern. It signals a potential switch from a downtrend to an uptrend. Traders highly regard this pattern. It reliably predicts market reversals. A big bearish candlestick forms, followed by a small doji. The doji is inside the body of the previous candlestick. The term “Harami” comes from the Japanese word for “pregnant.” This reflects how the small doji candle appears within the preceding candle.
Importance in Technical Analysis
Technical analysis relies heavily on patterns and signals to forecast future market movements. The Bullish Harami Cross is a crucial tool for traders. It can show a shift in market sentiment. Seeing this pattern can help traders make informed choices. It could lead to profitable trades.
Understanding Candlestick Patterns
Basics of Candlestick Charts
Many people use candlestick charts. They are a tool in technical analysis. They show price movements over time. Each candlestick represents a time period. It shows the open, close, high, and low prices.The candlestick’s body represents the range between the opening and closing prices, while the wicks (or shadows) indicate the highest and lowest prices.
Significance of Candlestick Patterns in Trading
Candlestick patterns provide insights into market psychology and potential future price movements. They help traders understand market sentiment. Traders use them to make predictions from past prices. Patterns like the Bullish Harami Cross are very valuable. They offer clear signals that can guide trading.
Components of a Bullish Harami Cross
The Bearish Candle
The first part of the Bullish Harami Cross is a bearish candlestick. It shows a strong downtrend. This candlestick has a long body and short wicks. It shows that sellers have dominated the market.
The Doji Candle
The second component is a doji candle, characterized by its small body and long wicks. A doji shows market indecision. Its opening and closing prices are nearly identical. This doji appears within the body of the previous bearish candlestick. It forms the Bullish Harami Cross.
Formation of the Bullish Harami Cross
Step-by-Step Formation Process

1. Downtrend: The market is in a downtrend, with a series of bearish candles.
2. Bearish Candle: A large bearish candlestick forms, continuing the downtrend.
3. Doji Candle: A doji candle appears within the previous bearish candle. It shows market indecision.
4. Potential Reversal: The pattern suggests a potential reversal. It shows the market sentiment shifting from bearish to bullish.
Visual Representation
Imagine a big red candle (bearish). It is followed by a small cross-like candle (doji) within it. This visual representation of the Bullish Harami Cross is easy to spot once you know what to look for.
Psychology Behind the Bullish Harami Cross
Market Sentiment During Formation
The Bullish Harami Cross forms during a big downtrend. The large bearish candle reflects strong selling pressure. But a doji within a bearish candle shows the selling pressure is waning. Buyers are starting to enter the market. This creates uncertainty and potential for reversal.
Trader Reactions and Market Behavior
Traders often see the Bullish Harami Cross as a signal. It means a bullish reversal is coming. More traders recognize this pattern. They buy more, which raises prices. This change in sentiment is crucial. It went from bearish to bullish. That change is needed for the pattern to work.
Identifying a patten on Charts
Key Characteristics
- A large bearish candlestick followed by a doji candle.
- The doji candle is entirely inside the body of the previous bearish candle.
- The pattern appears after a downtrend.
Common Mistakes to Avoid
- Misidentifying other patterns as the Bullish Harami Cross.
- Ignoring the overall trend and market context.
- Failing to confirm the pattern with more indicators or analysis.
Trading The pattern
Entry and Exit Strategies
To trade the Bullish Harami Cross effectively, consider the following strategies:
1. Entry Point: Enter the trade when the price moves above the high of the doji candle. This confirmation ensures that the reversal is taking place.
2. Exit Point: Set your exit point based on your risk tolerance and trading plan. Common exit strategies include taking profit at resistance levels or using trailing stops.
Setting Stop-Loss and Take-Profit Levels
- Stop-Loss: Place a stop-loss order below the low of the doji candle to minimize potential losses.
- Take Profit: profit levels using technical analysis. This analysis looks at resistance or Fibonacci retracement levels.
pattern in Different Market Conditions
Bullish Harami Cross in Uptrends
The Bullish Harami Cross is mainly a reversal pattern. But, it can also appear in uptrends. In this case, it may indicate a continuation of the upward trend rather than a reversal.
Bullish Harami Cross in Downtrends
In downtrends, the pattern is a powerful signal of a potential reversal. Traders should be particularly vigilant when this pattern appears after a prolonged downtrend.
Bullish Harami Cross in Sideways Markets
In sideways or ranging markets, the pattern may signal a shift. It signals a shift in the market’s direction. But, need to to confirm the pattern with more indicators. This is because there is no clear trend.
Bullish Harami Cross vs. Bullish Harami Pattern
Differences and Similarities
The Bullish Harami Cross and the Bullish Harami pattern are similar. But, they have clear differences:
– Bullish Harami Cross: Consists of a large bearish candle followed by a doji.
– Bullish Harami Pattern: A large bearish candle followed by a smaller bullish candle.
Which One is More Reliable?
The Bullish Harami Cross is often seen as more reliable. This is because it has a doji, which shows strong market indecision and a high chance of reversal.
bullish harami cross vs bearish harami cross
Bullish Harami Cross
A candlestick appears during a downtrend. It suggests a potential reversal to an uptrend.
A pattern shows a switch from strong selling to buying. This brings market indecision and a possible bullish reversal.
It is often seen as a strong reversal signal in bearish markets. This is especially true after a long downtrend.
Bearish Harami Cross
The Bearish Harami Cross appears during an uptrend. It suggests a potential switch to a downtrend
The Bearish Harami Cross shows a shift from strong buying to selling. This causes market indecision and a possible bearish reversal.
The Bearish Harami Cross is a strong reversal signal in bullish markets. This is especially after a long uptrend.
Historical Performance of the Bullish Harami Cross
Case Studies
Studying past cases can show how well the patterns work. Notable instances show this pattern predicted big market reversals. They can help traders see its potential.
Statistical Analysis
Studying the frequency and success rate of the pattern can show if it is reliable. This analysis is statistical. This analysis involves backtesting the pattern on historical data to assess its performance.
Combining with Other Indicators
Moving Averages
Using moving averages with the candlestick can make it more reliable.
For instance, short-term and long-term averages crossing over can confirm a reversal. The candlestick that indicated this reversal.
Fibonacci Retracement
Fibonacci retracement levels aid in pinpointing possible support and resistance levels. Combining these levels with the Bullish Harami Cross can give better points to enter and exit.
Advantages of Using the pattern
High Probability of Reversal
The Bullish Harami Cross often signals a market reversal. This makes it valuable for traders who want to profit from trend changes.
Clear Entry and Exit Signals
The pattern provides clear entry and exit signals. They reduce confusion and help traders make better choices.
Limitations and Risks
False Signals
Like any technical pattern, the Bullish Harami Cross is not infallible. False signals can occur, leading to potential losses. It’s crucial to confirm the pattern with more analysis.
Market Volatility
In highly volatile markets, the Bullish Harami Cross may be less reliable. Sudden price movements can ruin the pattern. So, it’s essential to use proper risk management.
How To Find Bullish Harami Cross Pattern Using Chartink.Com
Chartink.com Overview
Chartink.com is an online stock screener and charting tool. It lets traders scan for technical patterns and analyze market trends. Chartink.com has customizable filters and an easy interface. It’s a great resource for traders.
Below is the screenshot of how the websibsite looks , You can simply
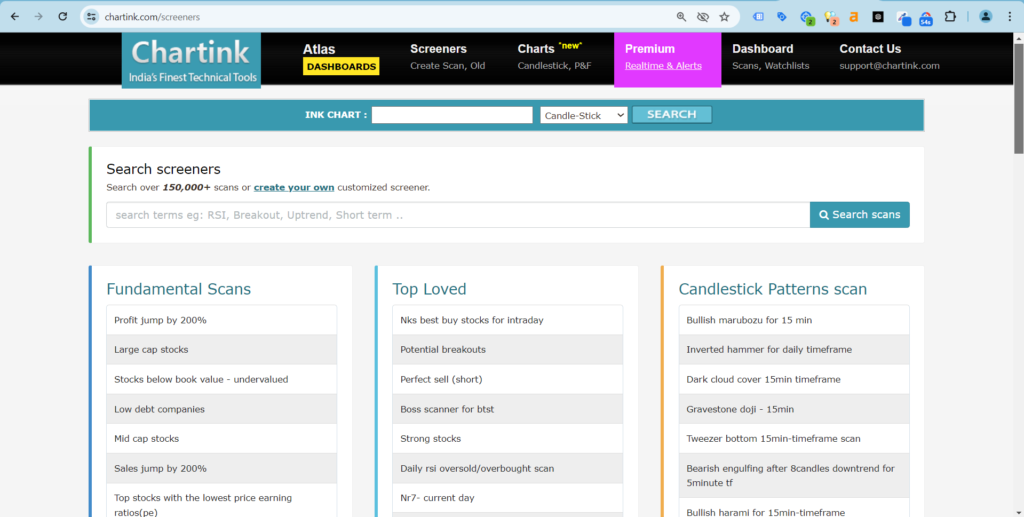
You can search for Bullish Harami Cross in screeners. It will show you all stock charts with a hammer pattern.
Tips for Beginners
Practice on Demo Accounts
Beginners should practice identifying and trading the Bullish Harami Cross. They should do this on demo accounts before using real money. This practice helps build confidence and refine trading strategies.
Continuous Learning and Adaptation
The financial markets are constantly evolving, and continuous learning is essential. Stay updated with market trends. Refine your strategies and adapt to changing conditions. This will improve your trading success.
Conclusion
The Bullish Harami Cross is a strong candlestick pattern. It offers valuable insights into possible market reversals. Traders can improve their technical analysis. They can do this by understanding how it forms and its psychology. This will increase their chances of success. The pattern is reliable. But, you must use it with other indicators and analysis techniques. They confirm signals and manage risks well.
FAQ
The Bullish Harami Cross is a candlestick pattern. It signals a potential end to a downtrend. It has two candlesticks. The first one is large and bearish. It is followed by a smaller candlestick with a lower closing price. The second candlestick is fully inside the first one.
The success rate of the Bullish Harami Cross varies. It depends on market conditions and other factors. Generally, it is a reliable reversal pattern. But, you can boost its power by confirming with more indicators.
The frequency of the Bullish Harami Cross depends on the market and timeframe. It is a rare pattern. But, it can offer big trading chances when it appears.
The Bullish Harami Cross may be less reliable in volatile markets. This is due to sudden price movements. You must confirm the pattern with other indicators. Also, you must use proper risk management in such conditions.
The Bullish Harami Cross can be traded on many timeframes. These range from intraday charts to daily or weekly charts. The choice of timeframe depends on the trader’s strategy and trading style.


I’m Prathamesh Tawde, a leading figure in the dynamic world of financial markets. Born on March 30, 1986, in the vibrant city of Thane, Maharashtra, I’ve nurtured a profound passion for technical analysis and a commitment to guiding individuals toward successful trading journeys. With a mission to empower and educate, I’ve carved a distinct niche as a content creator, educator, and mentor.