What is Hammer Candlestick Pattern and how to trade the pattern
- Prathamesh Tawde
- April 12, 2024
Hammer Candlestick Pattern
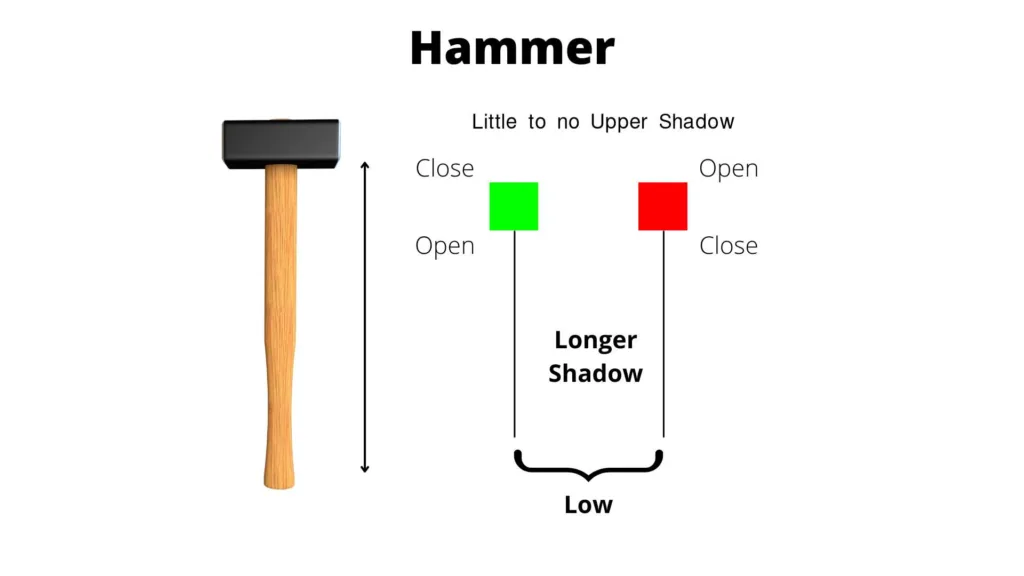
A hammer candlestick is a single-candle pattern which appears at the end of a downtrend. It signals a potential bullish reversal (Start of an Uptrend).
It consists of a small body at the top and a long lower wick.
The body can be either green (bullish) or red (bearish), but the color is less important than the shape.
The candlestick pattern’s shape looks like a hammer. That’s why it’s called the Hammer Candlestick Pattern.
Characteristics of a Hammer Candlestick
A candlestick is a hammer if it shows specific traits:
Length and position of the body: The body is small and positioned near the top of the candlestick.
Long lower wick: The lower wick should be at least twice the size of the body.
Little to no upper wick: There may be a small upper wick, but it should be minimal or absent.
Interpreting Hammer Candlesticks Pattern
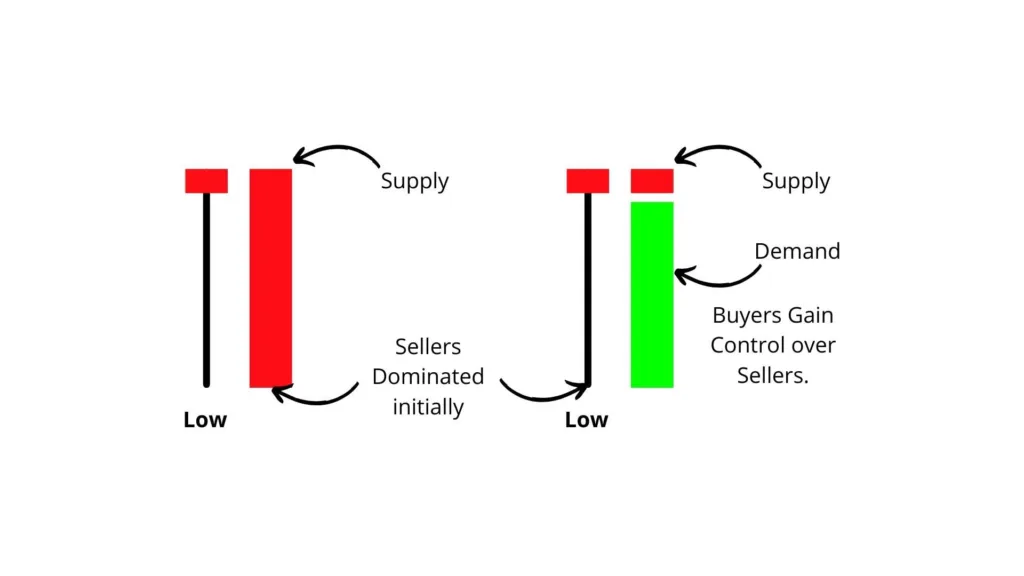
A hammer candlestick suggests that sellers dominated.
They did so at first, driving the price down.
But, buyers stepped in and pushed the price up. This shows a possible shift in market sentiment.
This reversal can be a signal to traders that the downtrend may be ending.
When to trade the Hammer Pattern
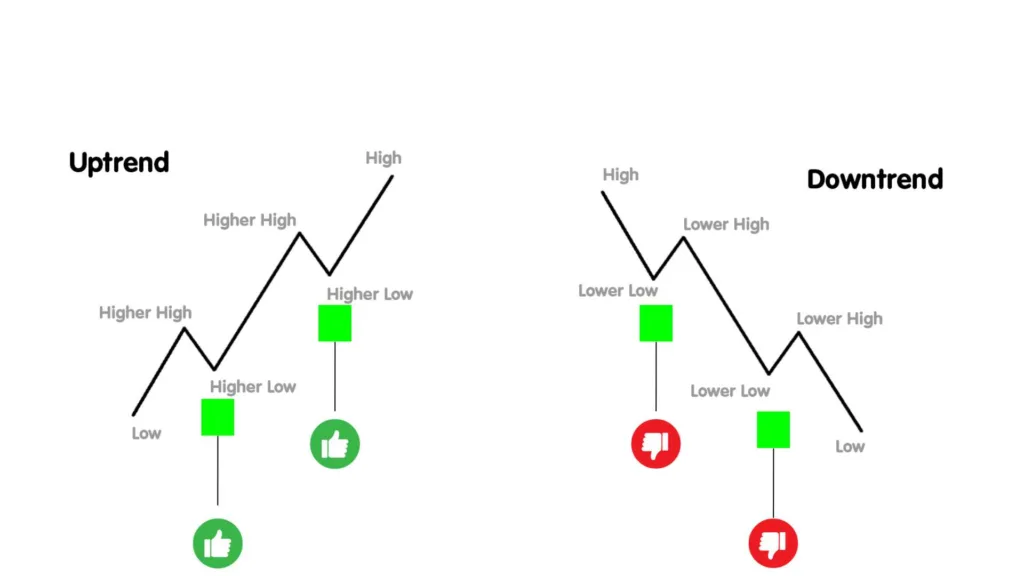
Although, A formation of Hammer Pattern Signifies a change in down trend to uptrend the best time to trade hammer is when the Stock prices are in uptrend
Hammer Candlestick Vs Dragonfly Doji

Similarities Between Hammer Candlestick and Dragonfly Doji
Both the Hammer Candlestick and Dragonfly Doji share several similarities:
Both patterns are bullish reversals. They suggest price may go up after falling.
They both feature long lower shadows, indicating a significant rejection of lower prices.
Both patterns suggest that buyers are starting to regain control from sellers.
Differences Between Hammer Candlestick and Dragonfly Doji
The Hammer Candlestick and Dragonfly Doji are similar. But, they have a few key differences.
Visual Differences
The Hammer Candlestick has a small real body at the top. The Dragonfly Doji has a flat top with little to no real body.
The Hammer Candlestick may have a small upper shadow, while the Dragonfly Doji has none.
Trading Implications
Both patterns show possible bullish reversals. But, the Hammer Candlestick may signal a stronger one. This is because of its real body.
Traders might use different signals or timeframes to confirm each pattern. They do this due to their subtle differences.
Hammer Candlestick Vs Inverted Hammer candlestick Pattern.

Similarities Between Hammer and Inverted Hammer Candlesticks
Both the Hammer and Inverted Hammer Candlesticks share some similarities:
Both have small real bodies and long shadows (lower for hammer, upper for inverted hammer).
Both are reversal patterns, suggesting a potential change in market direction.
Similarities Between Hammer and Inverted Hammer Pattern
The primary differences between the two patterns are their implications and entry points:
The implications are opposite. A hammer signals a bullish reversal. It appears at the bottom of a downtrend. An inverted hammer signals a bearish reversal at the top of an uptrend.
Different Entry Points: Hammer says to enter long. Inverted hammer says to enter short.
Trading Hammer pattern at Different Time Frames
A pattern gives you various results. The results vary with time frames.
Let’s look at how you can trade using the Hammer pattern. You can use it on time frames like the Daily, Weekly, and intraday.
Daily Time Frame
A hammer on a daily chart suggests a potential reversal that may play out over the next few days. This time frame is less prone to noise and offers higher accuracy in identifying trends.
Intraday Time Frames
Hammer Pattern is more commen in short time frames, like hourly or 15-minute charts.
These time frames are more sensitive to short-term market movements. They let traders to enter and exit positions .
But, they can also be more volatile and noisy. This requires careful analysis and confirmation.
Weekly Time Frame
Trading the hammer pattern on the weekly time frame shows long-term market trends. A weekly hammer pattern suggests a potential reversal.
It may happen over weeks or even months. This time frame is ideal for swing or position traders who aim for longer-term gains.
Hammer pattern Examples
How to find hammer pattern using Chartink.com
Chartink.com Overview
Chartink.com is an online stock screener and charting tool. It lets traders scan for technical patterns and analyze market trends. Chartink.com has customizable filters and an easy interface. It’s a great resource for traders.
Below is the screenshot of how the websibsite looks , You can simply
You can search for Hammer Patter in screeners. It will show you all stock charts with a hammer pattern.
Keep in Mind, Some hammer patterns are wrong and won’t give the right signal. We will only use screeners to find likely hammer patterns.
Limitations of Using Candlesticks Pattern
While hammer candlesticks can be a useful tool, they come with various limitations:
The hammer pattern can produce false signals. This is especially true in volatile markets or when market conditions are unclear. A hammer pattern may appear but not cause a big reversal. This causes traders to trade on bad info.
The hammer pattern’s effectiveness varies across time frames. It is inconsistent. It may be reliable on daily or weekly charts. But, it might not work on shorter time frames like hourly or 15-minute charts.
Without confirmation, relying on the hammer pattern can lead to bad trades. You need to consider other factors or technical indicators. Other forms of analysis should confirm the pattern to improve accuracy.
Stoploss and Profit
When trading the hammer pattern. Consider the following strategies for entry, exit, and risk management:
Entry Point: Go long when the next candlestick closes above the hammer’s high. This confirms the bullish reversal.
Use a stop-loss. Place it below the low of the hammer candlestick. This limits potential losses.
Set a take-profit order at key resistance levels. Or, use a risk-reward ratio (e.g., 1:2 or 1:3) from your strategy.
Conclusion
The hammer candlestick pattern is a powerful tool for traders. It signals potential bullish reversals at the end of a downtrend. Knowing the pattern’s traits and how to read its signals can give you an edge. But, it’s important to recognize the limits of using hammer patterns. They can cause false signals.
Success in trading comes from discipline, good analysis, and ongoing learning. Happy trading!
Join the best stock market courses in thane
FAQs
A Hammer Candlestick is a bullish reversal pattern in candlestick charting. It forms when the price opens much lower than its closing level. But then, it rallies to close near or above its opening price. This pattern resembles a hammer.
To identify a Hammer Candlestick, look for a small body near the top of the trading range. It will have a long lower wick (shadow) at least twice the length of the body. The long lower wick suggests that sellers pushed the price lower during the session. But, it’s buyers who brought it back up by the close.
A Hammer Candlestick often indicates a potential reversal in a downtrend. This suggests that, despite early selling pressure, buyers are stepping in. They are pushing the price higher. This signals a possible shift from bearish to bullish sentiment.
Hammer Candlesticks can appear in various financial markets, including stocks, forex, and commodities. They work best after a long downtrend. They indicate that sellers are worn out and suggest that a turning point may be approaching.
Traders often use Hammer Candlesticks as a signal. They use them to enter long positions or to tighten stop-loss orders on short ones. But you must confirm the signal with other indicators or price patterns. This is key for making it more reliable.

I’m Prathamesh Tawde, a leading figure in the dynamic world of financial markets. Born on March 30, 1986, in the vibrant city of Thane, Maharashtra, I’ve nurtured a profound passion for technical analysis and a commitment to guiding individuals toward successful trading journeys. With a mission to empower and educate, I’ve carved a distinct niche as a content creator, educator, and mentor.
