What Is Hanging Man Candlestick & How To Trade The Pattern ?
- Prathamesh Tawde
- December 6, 2023
Traders need candlestick patterns. They use them to see market movements and predict reversals. Among these patterns, the Hanging Man is a strong indicator. It signals a potential reversal in an uptrend. In this article, we’ll explore the Hanging Man candlestick pattern in detail. We’ll cover its significance and how you can use it in your trading strategies.
What is a Hanging man Candlestick?
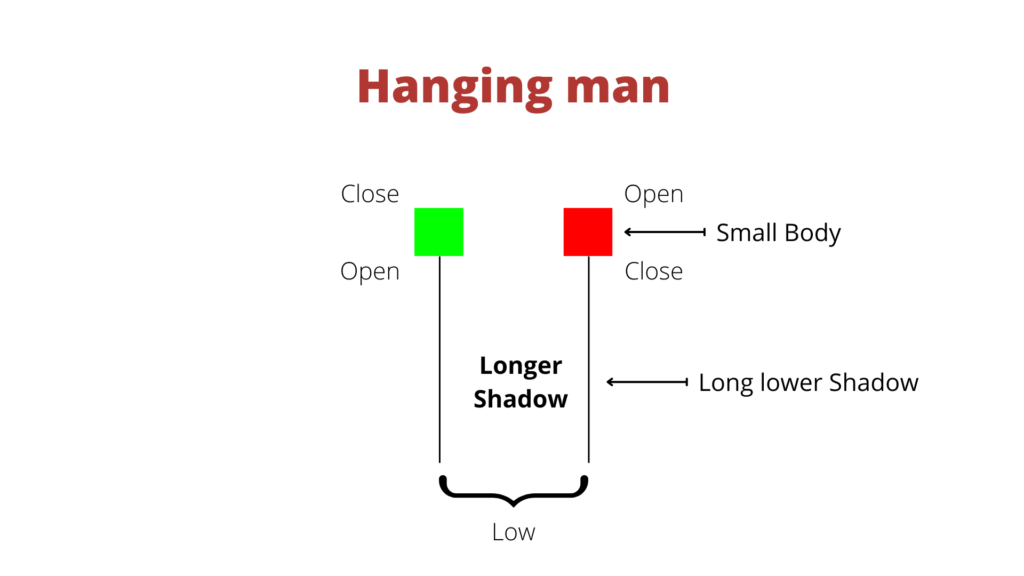
The Hanging Man is a bearish reversal pattern. It usually appears at the end of an uptrend. The pattern has a small real body. It is near the top of the candlestick and can be bullish or bearish. The candlestick also has a long lower wick. The upper wick is either absent or very short. This pattern suggests that sellers may soon control the market. This control could lead to a downtrend.
How does an Hanging Man candlestick Pattern form?

The Hanging Man forms when the following conditions are met during an uptrend:
The market is in an uptrend.
A small real body forms near the top of the trading range.
The lower shadow is at least twice the length of the real body.
There is little or no upper shadow.
This shows that the bulls have been in control. But, the bears made a strong push during the period. This raised the chance of a bearish reversal.
Body Size and Positioning: The real body of the candlestick is small and located at or near the top of the candle.
Wick Length and Direction: The lower wick is long, at least twice the real body’s size. The upper wick is tiny.
Color of the Candlestick: The color isn’t as important. But, a red (bearish) body may strengthen the bearish signal.
Psychology of the Hanging Man
The Hanging man and Hammer patterns look the same. But, they give a different market view. The Hanging Man Pattern signals a bearish reversal. The hammer pattern signals a bullish one. Here’s a closer look at the Hanging Man and Hammer candlestick patterns:
Hanging Man vs Hammer Candlesticks
The Hanging man and Hammer patterns look the same. But, they give a different market view. The Hanging Man Pattern signals a bearish reversal. The hammer pattern signals a bullish one. Here’s a closer look at the Hanging Man and Hammer candlestick patterns:
Hanging Man Candlestick
Market Trend: The Hanging Man pattern appears at the end of an uptrend. It signals a possible bearish reversal.
Appearance: It has a small real body at or near the top of the candlestick. It has a long lower wick (at least twice the length of the body) and little to no upper wick. The body can be either bullish (green) or bearish (red).
The pattern shows that sellers are gaining strength. They may soon take control, leading to a potential price drop.
To confirm a Hanging Man pattern, use more indicators or patterns. Then, make trading decisions.
Hammer Candlestick
Market trend: The Hammer pattern appears at the end of a downtrend. It signals a potential bullish reversal.
Appearance: It has a small real body at or near the top of the candlestick. It also has a long lower wick (at least twice the length of the body) and little to no upper wick. The body can be either bullish (green) or bearish (red).
The pattern suggests that buying pressure is rising. Buyers may soon take control, leading to a potential price increase.
Like the Hanging Man pattern, traders must confirm the Hammer pattern. Use more indicators or patterns for better trades.
hanging man candle Confirmation and Reliability
The Hanging Man pattern works better when confirmed by other indicators or patterns. For example, if the pattern appears at a resistance level. Or, it appears with a bearish divergence on an oscillator. This raises the chance of a reversal. Waiting for a confirmation day is key. On this day, prices must close lower than the Hanging Man. This confirms the pattern.
Spotting the Hanging Man Pattern using Chartink.com
Chartink.com Overview
Chartink.com is an online stock screener and charting tool. It lets traders scan for technical patterns and analyze market trends. Chartink.com has customizable filters and an easy interface. It’s a great resource for traders.
Below is the screenshot of how the websibsite looks , You can simply
You can search for Hanging man pattern in screeners. It will show you all stock charts with a Hanging man Pattern.
Keep in Mind, Some Hanging man pattern are wrong and won’t give the right signal. We will only use screeners to find likely Hanging man pattern.
Conclusion:
The Hanging Man pattern is a potent tool in the arsenal of technical analysts and traders. It can signal potential trend reversals after an uptrend. This ability makes it valuable for finding profitable trades. But like all technical indicators, traders should not use it in isolation. Confirmation is crucial. It comes from later price action, volume analysis, and other indicators. It’s key for making informed trades.
Traders who master the Hanging Man pattern can better predict markets. They can improve their trading. Traders can combine the Hanging Man with other analysis tools. They can also use sound risk management. This helps them navigate financial markets better.
The Hanging Man is a bearish candlestick pattern. It appears after an uptrend. It features a small real body near the top of the trading range with a long lower shadow and little or no upper shadow. This pattern suggests that selling pressure is rising. It could signal a switch from a bullish to a bearish trend.
- Traders can confirm the Hanging Man pattern by looking for additional bearish signals. These may include:
- A subsequent bearish candlestick, such as a bearish engulfing pattern.
- Increased trading volume accompanying the Hanging Man.
- Technical indicators like the Relative Strength Index (RSI) show overbought conditions.
- A breakdown of key support levels.
The long lower shadow in the Hanging Man pattern shows that, during the session, sellers pushed the price far down. However, by the end of the session, buyers regained control and pushed the price back up towards the open. This suggests weakening bullish momentum and the possibility of a trend reversal.
The Hanging Man pattern provides a valid signal when it occurs after a sustained uptrend. Consider the broader market context. Also, seek confirmation from other indicators or candlestick patterns. Do these before trading based solely on the Hanging Man.
Some common mistakes traders make when trading the Hanging Man pattern include:
Failing to wait for confirmation before entering a trade.
Ignoring the broader market context and trading the pattern in isolation.
Overlooking the importance of risk management and setting appropriate stop-loss orders.
Relying only on candlestick patterns is a mistake. You must also consider other technical tools and market factors.

I’m Prathamesh Tawde, a leading figure in the dynamic world of financial markets. Born on March 30, 1986, in the vibrant city of Thane, Maharashtra, I’ve nurtured a profound passion for technical analysis and a commitment to guiding individuals toward successful trading journeys. With a mission to empower and educate, I’ve carved a distinct niche as a content creator, educator, and mentor.


